
Jump to section
Define what a qualified lead means in revenue terms
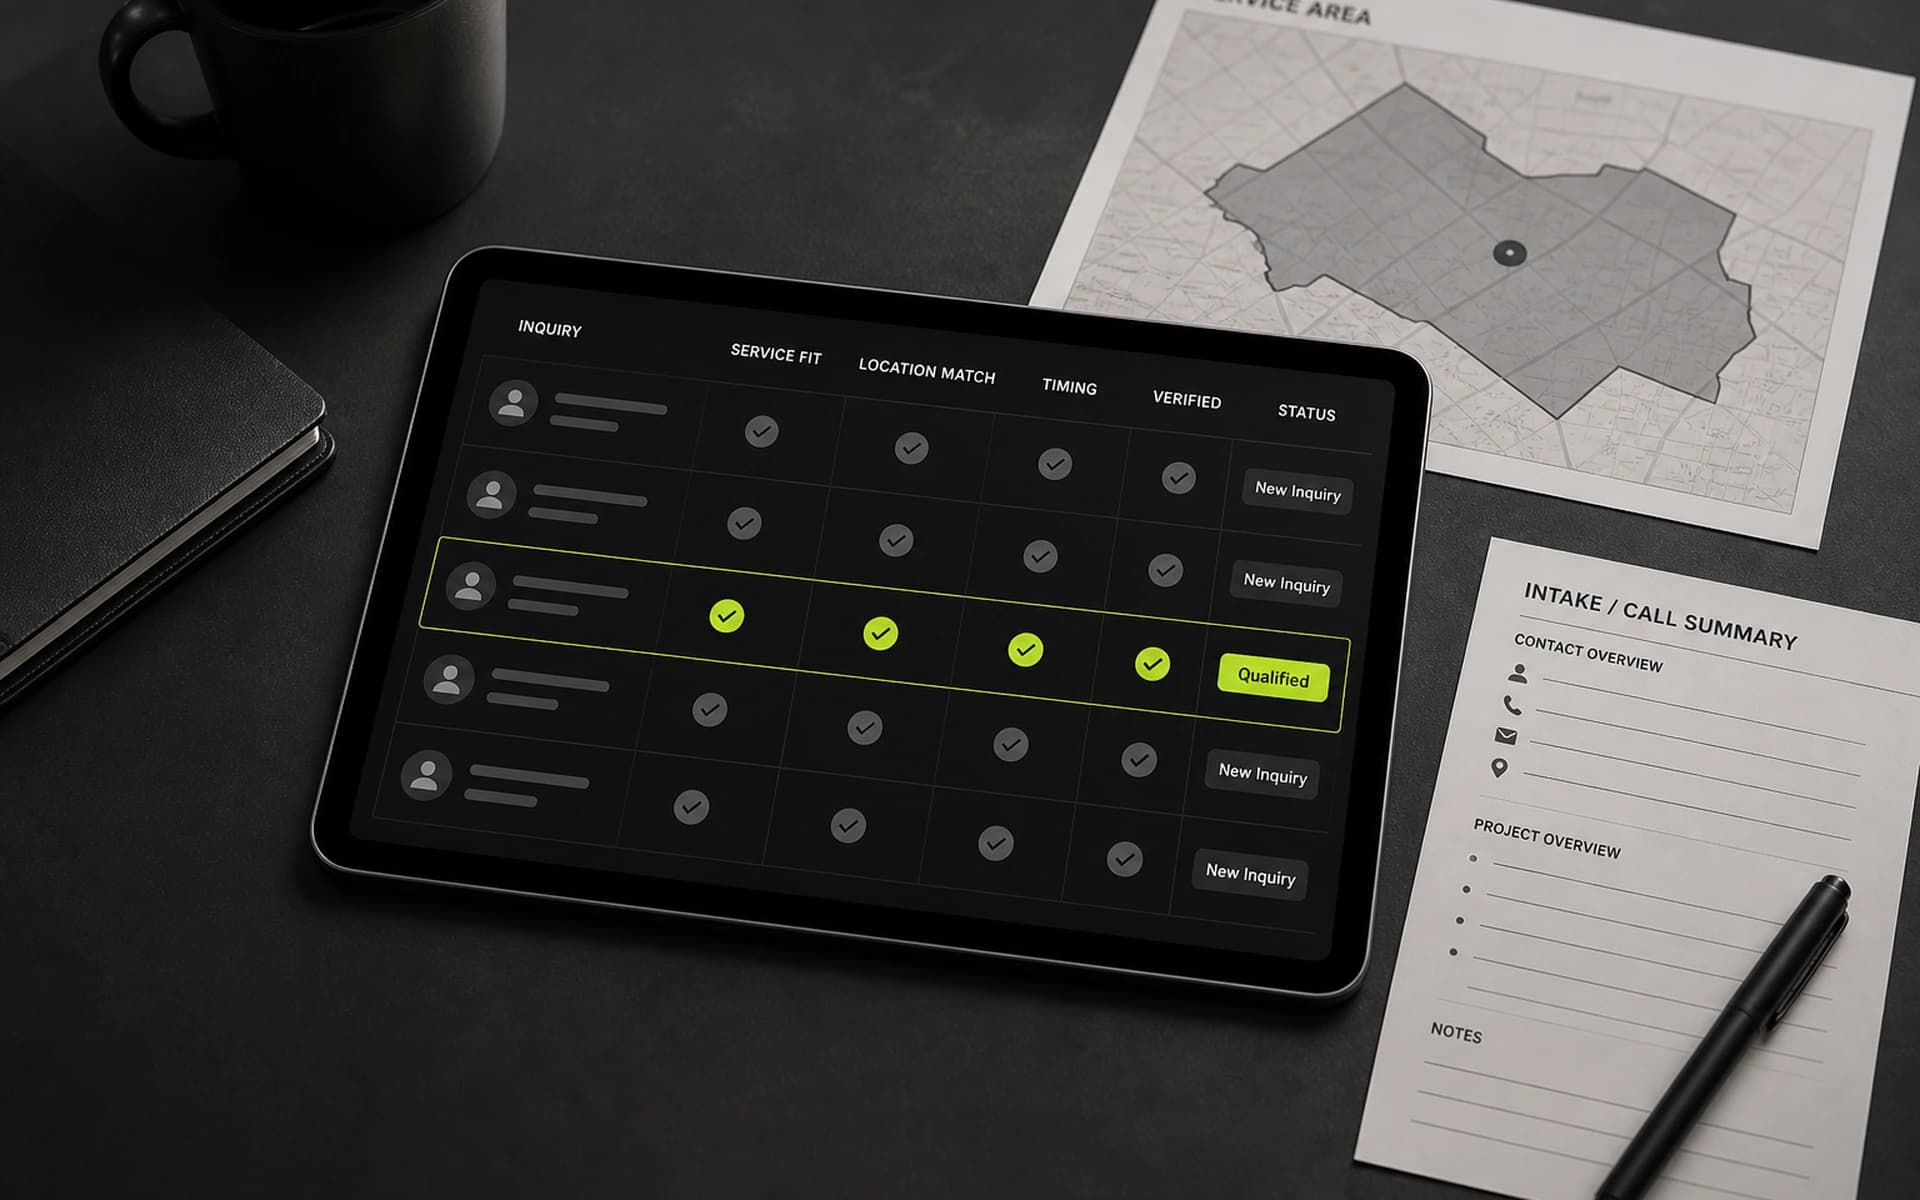
Marketing and sales often use different definitions of quality. Align around criteria like project fit, timeline, budget range, and location.
Without shared qualification standards, optimization decisions will stay inconsistent. For stage-by-stage funnel benchmarks once definitions are shared, use How to Build a High-Converting Lead Funnel—that guide is stage rates; this one is quality definition, scoring, and source comparison.
Calibrate a two-dimensional lead scoring model
A definition without a score stays a slide. A well-calibrated B2B lead scoring model in 2026 typically runs a two-dimensional structure: a 100-point composite that combines behavioral engagement (up to 50 points), firmographic or demographic fit (up to 30 points), and intent signals (up to 20 points).
Behavior should be tiered by intent level—not treated as one flat “engaged” bucket. High-intent actions include demo requests, pricing-page views, and trial signups. Medium-intent covers gated content downloads and webinar attendance. Low-intent includes newsletter signups. Fit attributes should be weighted by role or seniority and company size so a high-activity intern does not outrank a quiet decision-maker at a right-fit account.
Engagement velocity matters as much as engagement volume. A prospect who visits three high-intent pages within 10 minutes is roughly 5× more valuable than one who visits ten pages spread across three months. Recency and clustering of intent signals should be weighted—raw page-view counts alone will over-score browsers and under-score buyers who move fast.
The practical test of calibration is not whether the CRM produces a number. Once scoring is properly tuned, MQL-to-SQL conversion should land between roughly 25–45%. If your score ranks “hot” leads that sales rejects, the weights are wrong—not the sales team. Use How to Build a High-Converting Lead Funnel when you need the broader funnel-stage context around MQL and SQL terminology; keep this section focused on the scoring architecture that protects quality upstream.
Pre-qualify in ads and landing pages
Include service scope, geography, and clear outcome framing before users click or submit.
Pre-qualification usually reduces raw volume slightly while improving pipeline efficiency and close rate. Creative that filters for fit (without restating conversion-rate gaps covered elsewhere) pairs with how to lower cost per lead with better creative. For lander message match and form-length specifics, see The Role of Landing Pages in Lead Generation.
Use form design to balance intent and friction
You can increase quality by adding the right qualifying questions without overwhelming high-intent users.
Short multi-step forms often outperform long single forms when designed around buyer psychology. Field count alone is not the whole lever: conditional logic (showing/hiding fields based on prior answers) has delivered up to a 215% increase in qualified leads for B2B/SaaS companies in documented cases, and progressive profiling has been shown to boost form submissions by about 42%, generate about 61% more MQLs, and create about 27% more sales opportunities—evidence that *how* a form asks affects both volume and quality.
Build source-level quality reporting
Track qualified rate by campaign, keyword, and creative. This reveals where volume is cheap but low-value.
Lead quality varies sharply by source, not just by process: lead-to-MQL conversion rates range from roughly 17% for construction-industry leads up to 56% for client referrals, with SEO-generated leads achieving the highest rate among digital marketing channels specifically—about 41%. Source-level reporting is not an attribution nicety; blended reporting hides structural channel differences.
Quality-based budget shifts should happen weekly for active accounts.
- Lead to qualified opportunity rate
- Qualified opportunity to booked call rate
- Close rate by source and campaign cluster
Install closed-loop outcome reporting on a working cadence
Source reports show where quality is weak. Closed-loop reporting is what lets the scoring model—and everything upstream of it—improve over time. When a lead progresses through the pipeline and closes, that outcome data needs to flow back into the marketing and ad platforms so the system learns what a real, profitable buyer looks like—not just what a form-filler looks like.
Cadence matters as much as the data pipe. Teams should run a weekly or bi-weekly session where sales reports lead quality by source and marketing adjusts scoring thresholds and targeting based on what is actually converting. Some organizations run a tighter 24-hour “lead feel” loop for faster iteration, though weekly or bi-weekly is the more common working cadence for most service businesses.
This is not a hypothetical best practice. HubSpot’s State of Marketing data found that among companies with a functioning feedback loop between sales and marketing, roughly 93.7% reported improved lead quality year over year. If your CRM outcomes never reach the ad account or the scoring weights, you are optimizing for form fills while revenue quietly drifts.
Create a feedback loop with sales
Sales conversations expose recurring objections and disqualifiers that marketing cannot see in platform dashboards.
Feed this insight back into ad copy, page messaging, and qualification logic to steadily raise fit quality. For phone-lead intake and on-call qualification patterns, pair with call intake for high-volume local leads. Operationalize with Strategy & Consulting and keep browsing patterns in Strategy & Growth.
Want better-fit leads from your current spend?
We optimize paid and organic funnels around closeable opportunities, not vanity volume.
Improve lead quality